What this measures.
This is our secondary analysis of Department for Transport table NTS0904. It measures cars in the England household survey after the table’s exclusions. Mileage is estimated by the respondent. It is not odometer-verified mileage, a count of drivers, or a UK vehicle-fleet census. Three- and four-wheeled cars and SUVs are included.
“Below 5,000” means fewer than 5,000 miles, not “5,000 or fewer”. There is no universal insurance definition of low mileage. These thresholds follow complete statistical bands and do not establish a policy’s eligibility or likely price.
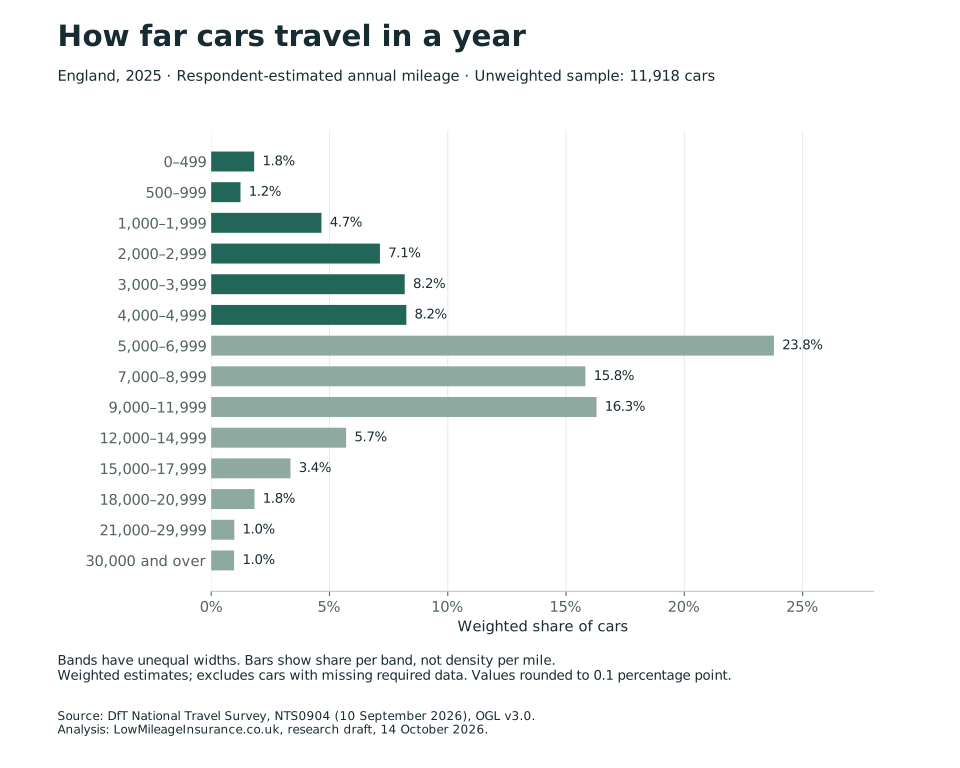
At the band boundaries.
| Annual mileage threshold | Weighted share |
|---|---|
| Below 3,000 miles | 14.8% |
| Below 5,000 miles | 31.3% |
| Below 7,000 miles | 55.1% |
| Below 9,000 miles | 70.9% |
The source groups 5,000–6,999 miles together. It cannot tell us the exact share below 6,000. We do not interpolate within that band.
Why precision matters.
The spreadsheet displays rounded whole percentages but stores more precise values. We add those underlying values and round the final result once. Adding the visible labels can produce a different total.
These remain survey estimates. We have not calculated confidence intervals or tested statistical significance. Decimal places describe the calculation, not certainty about the population.
See all 2025 mileage bands and source cells
| Annual band | Weighted share | Source cell |
|---|---|---|
| 0–499 miles | 1.8% | NTS0904.B30 |
| 500–999 miles | 1.2% | NTS0904.C30 |
| 1,000–1,999 miles | 4.7% | NTS0904.D30 |
| 2,000–2,999 miles | 7.1% | NTS0904.E30 |
| 3,000–3,999 miles | 8.2% | NTS0904.F30 |
| 4,000–4,999 miles | 8.2% | NTS0904.G30 |
| 5,000–6,999 miles | 23.8% | NTS0904.H30 |
| 7,000–8,999 miles | 15.8% | NTS0904.I30 |
| 9,000–11,999 miles | 16.3% | NTS0904.J30 |
| 12,000–14,999 miles | 5.7% | NTS0904.K30 |
| 15,000–17,999 miles | 3.4% | NTS0904.L30 |
| 18,000–20,999 miles | 1.8% | NTS0904.M30 |
| 21,000–29,999 miles | 1.0% | NTS0904.N30 |
| 30,000 and over miles | 1.0% | NTS0904.O30 |
Compare years with care.
The share below 5,000 miles was 28.7% in 2019 and 31.3% in 2025, a descriptive difference of 2.5 percentage points. The equivalent 2024 estimate was 31.9%. We do not claim these differences are statistically significant.
2020–2022 reflect pandemic-related changes in travel, data collection and sample size. Samples increased from 2023. DfT states that interview-based statistics are unaffected by the 2025 digital travel diary change. All years here use the same revised release, including its pre-2013 fuel-coverage revisions.
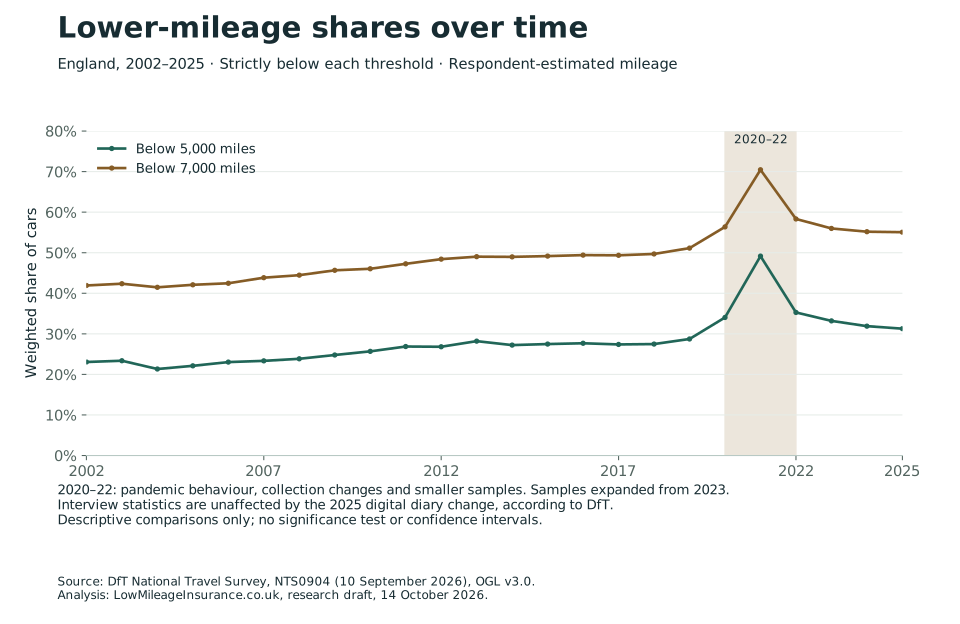
See the 2002–2025 series and annual sample sizes
| Year | Below 5,000 miles | Below 7,000 miles | Sample cars |
|---|---|---|---|
| 2002 | 23.1% | 41.9% | 7,351 |
| 2003 | 23.4% | 42.4% | 7,855 |
| 2004 | 21.3% | 41.5% | 7,496 |
| 2005 | 22.1% | 42.1% | 8,211 |
| 2006 | 23.0% | 42.5% | 8,134 |
| 2007 | 23.3% | 43.8% | 7,962 |
| 2008 | 23.8% | 44.5% | 8,112 |
| 2009 | 24.8% | 45.7% | 8,363 |
| 2010 | 25.7% | 46.0% | 8,181 |
| 2011 | 26.9% | 47.3% | 7,748 |
| 2012 | 26.8% | 48.4% | 8,188 |
| 2013 | 28.2% | 49.0% | 8,324 |
| 2014 | 27.2% | 49.0% | 7,967 |
| 2015 | 27.5% | 49.2% | 8,173 |
| 2016 | 27.7% | 49.4% | 8,104 |
| 2017 | 27.4% | 49.4% | 7,552 |
| 2018 | 27.5% | 49.7% | 7,469 |
| 2019 | 28.7% | 51.1% | 7,495 |
| 2020 | 34.0% | 56.4% | 3,631 |
| 2021 | 49.2% | 70.5% | 5,364 |
| 2022 | 35.3% | 58.3% | 4,733 |
| 2023 | 33.2% | 56.0% | 8,161 |
| 2024 | 31.9% | 55.2% | 9,861 |
| 2025 | 31.3% | 55.1% | 11,918 |
Reproduce the principal result.
- Use the pinned source.Download the research pack. Its original NTS0904 ODS is the 10 September 2026 release; source.json records the URL, retrieval date and SHA-256 checksum.
- Run the calculation.With Python 3.10 or later, run
python reproduce/study.py --output reproducedfrom the unzipped pack. No network or additional Python packages are needed. - Compare outputs.The three mileage CSV/JSON files must match the supplied files byte for byte. Below 5,000 sums NTS0904 cells B30:G30; below 7,000 sums B30:H30, using underlying numeric values.
The parser checks the source hash, column definitions, year coverage, positive sample sizes and reconciliation of band shares to 100%. Cars with missing age, ownership or estimated trip-purpose mileage are excluded by DfT. The full methods explain uncertainty, data fields and optional figure regeneration.
Download and reuse.
- All mileage bands, 2002–2025 (CSV) and threshold calculations (CSV)
- Complete study and provenance (JSON) and original DfT table (ODS)
- Distribution chart: SVG · PNG
- Trend chart: SVG · PNG
- Research pack with source and reproduction code (ZIP)
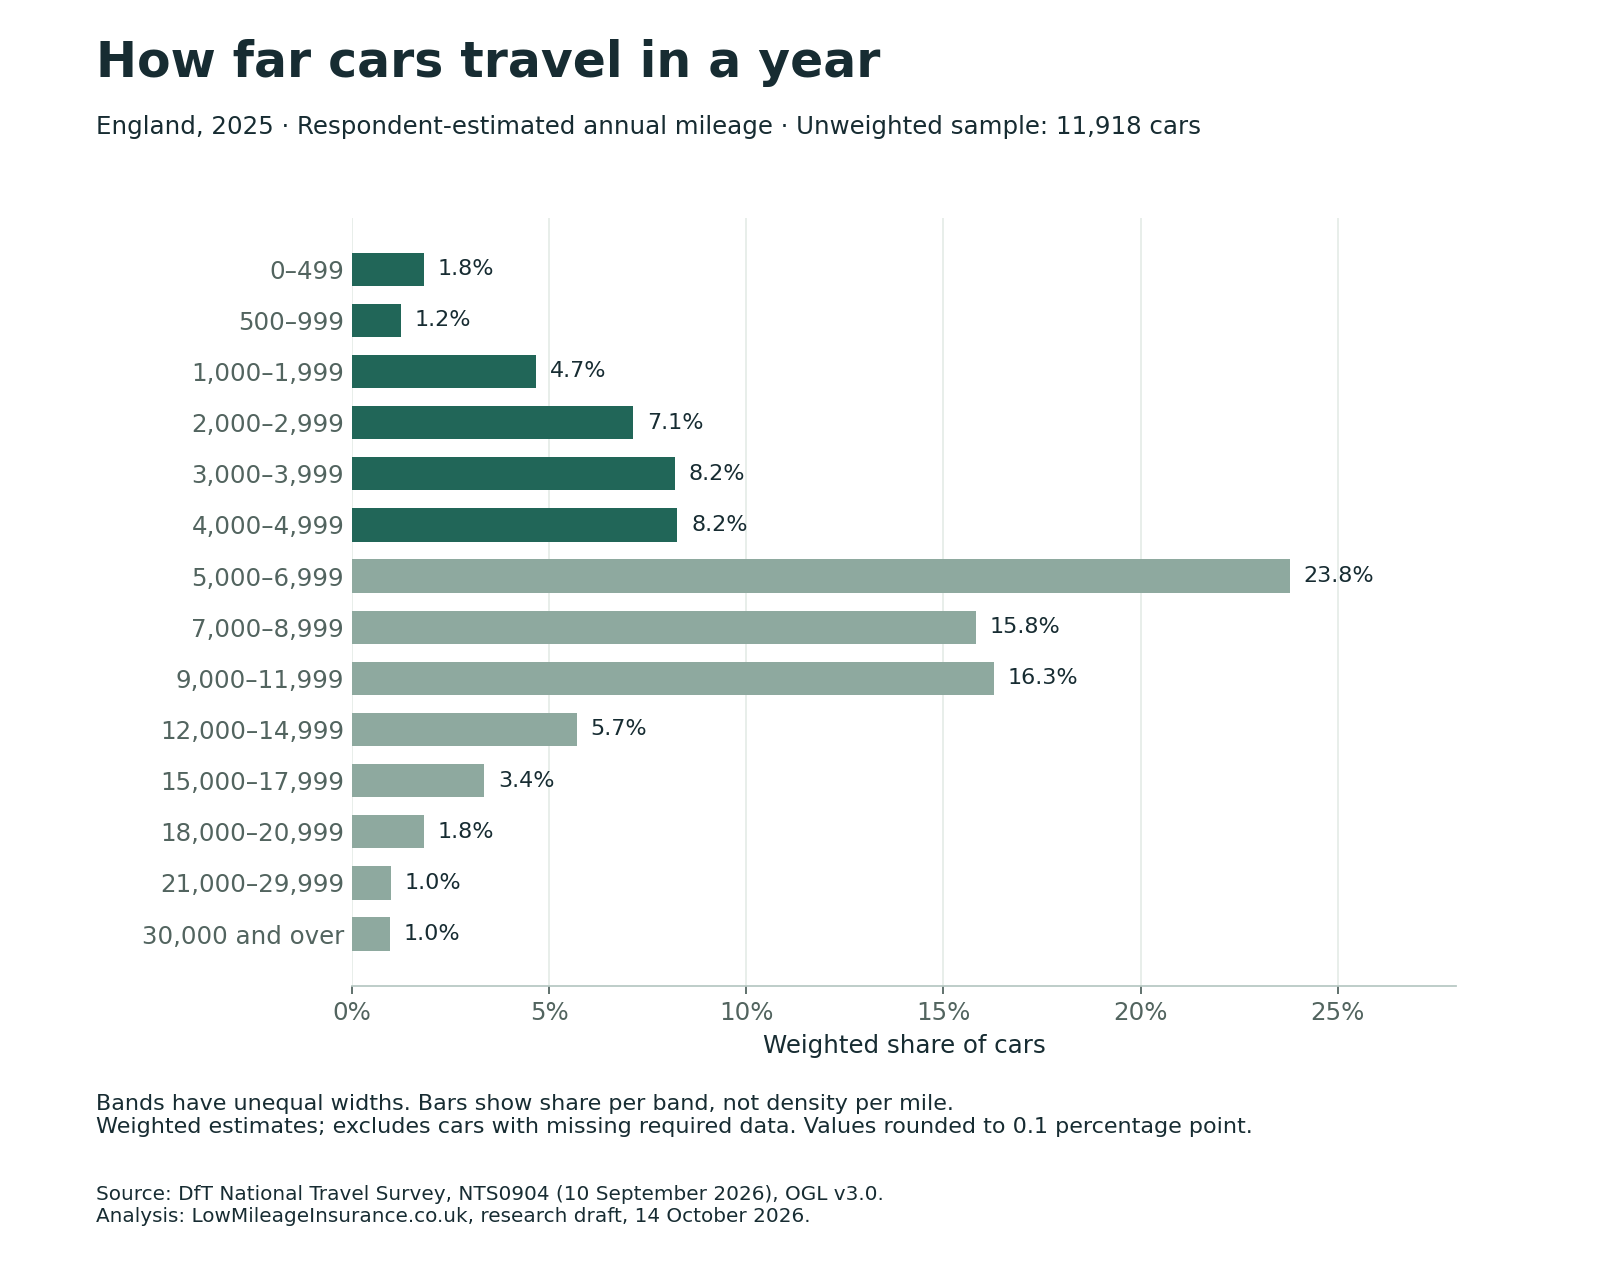
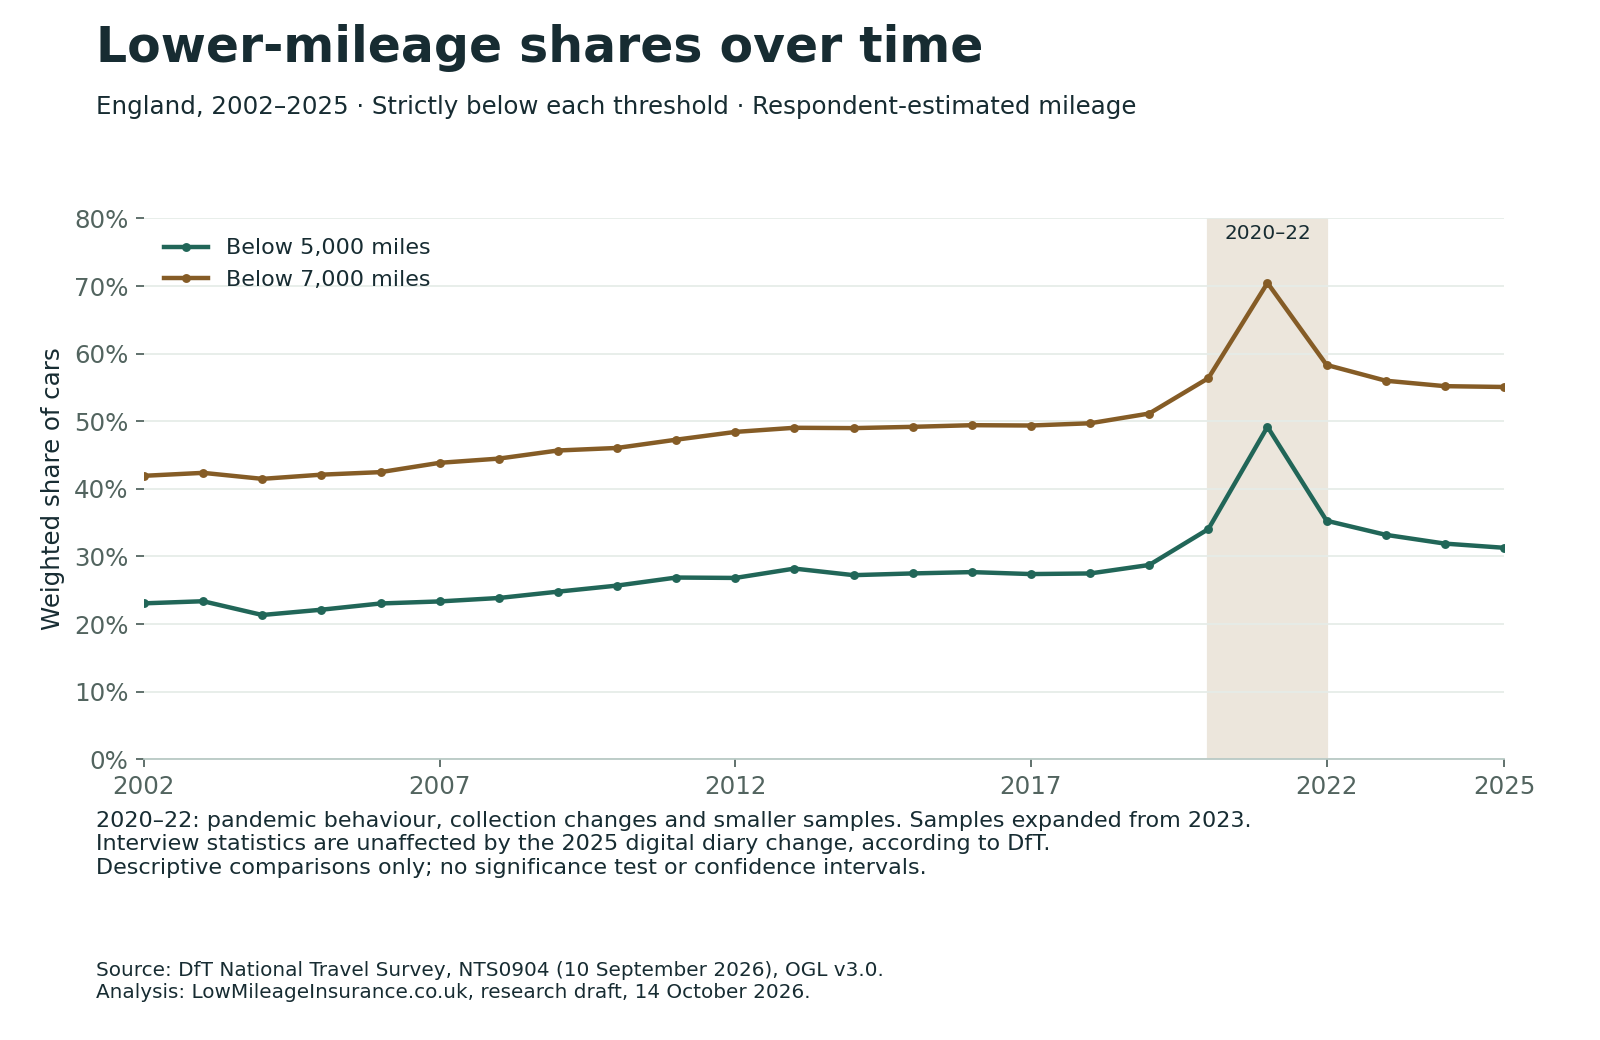
Suggested credit: Department for Transport, National Travel Survey NTS0904, 2025 data (10 September 2026 release); analysis by LowMileageInsurance.co.uk, version 1.0, 14 October 2026. Preserve the England scope, period and limitations when reusing charts.
Primary sources and corrections.
- DfT NTS09: vehicle mileage and occupancy (external website)
- Exact NTS0904 source workbook (external website)
- NTS 2025 quality report (external website)
- Open Government Licence v3.0 (external website)
All source data checked on 14 October 2026. DfT lists the next workbook update as summer 2027. The release index and pinned file are included in our source-monitoring checks; changes require review before replacement.
Found a problem? Prepare a correction and identify the study, source cell and proposed change. To estimate your own mileage, use the annual mileage worksheet.